UPDATE 9/19/2011: I’ve moved this plugin over to github: https://github.com/justintime/nagios-plugins. It now has a PNP template, and support for AIX as well.
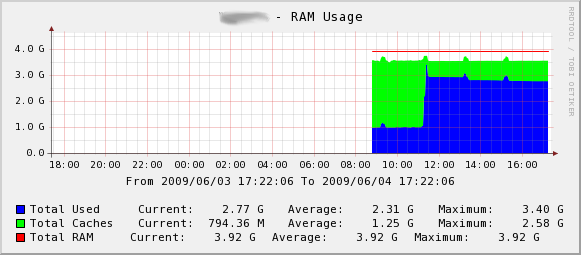
We have always monitored RAM usage on all of boxes. Sure, there’s the argument that unused RAM is money wasted, but I always like to know not just when the box is swapping, but when it’s about to start swapping. There have been a few plugins over the years that I’ve used for this - check_ram for Solaris, check_mem for Linux, and there’s also check_mem.pl. Well, migrating to Solaris 10 and ZFS started tripping the check_ram thresholds due to the ZFS ARC cache. So, I attempted to pull together a cross platform Nagios plugin that did it’s best to give me what I wanted, and what do you know, it works! This graph shows the ZFS ARC cache at it’s best:
So, I started with the check_mem.pl script that’s included in the contrib folder of the official Nagios Plugins. What emerged when I was done was quite different. Here’s some key differences:
- If run on a Solaris host:
- If the Sun::Solaris::Kstat module is available, it grabs the total memory, memory in use by the ZFS ARC cache, and free memory using that module. If not, it uses vmstat and prtconf to determine total, used, and free memory. There’s no easy way to track ARC cache usage without the module.
- If run on a Linux host:
- It uses /proc/meminfo to gather total memory, used memory, free memory, and cache/buffer memory.
- If run on another Unix host:
- It uses vmstat to do what it can. This code is unchanged from the original check_mem.pl.
- If ran on a supported OS (Solaris with Kstat, or Linux), you can use the -C command line option which counts the cache memory as free memory when comparing it to the warning and critital thresholds.
- I enabled perfdata output for Nagios to use.
- Any user can run the plugin.
Let’s show an example, run from a Solaris host with ZFS:
$ /usr/local/nagios/libexec/check_mem.pl -w 10 -c 5 -f
WARNING - 9.9% (406520 kB) free!|TOTAL=4113824KB;;;; USED=3707304KB;;;; FREE=406520KB;;;; CACHES=816947KB;;;;
Uh oh! I have less than 10% free of the 4GB total. Wait, the ZFS ARC is using up 800MB of that! Let’s try again with the -C option:
$ /usr/local/nagios/libexec/check_mem.pl -w 10 -c 5 -f -C
OK - 29.7% (1220611 kB) free.|TOTAL=4113823KB;;;; USED=2893212KB;;;; FREE=1220611KB;;;; CACHES=817075KB;;;;
That’s better! You’ll see the same sort of thing on Linux. Maybe some day I’ll share the nasty hackery that is getting Nagios perfdata into Cacti automagically, but I don’t know if the world’s ready for that yet ;-) Until then, give my plugin a try, and let me know how it works. If you have another OS for me to add, I’d love to code it up!